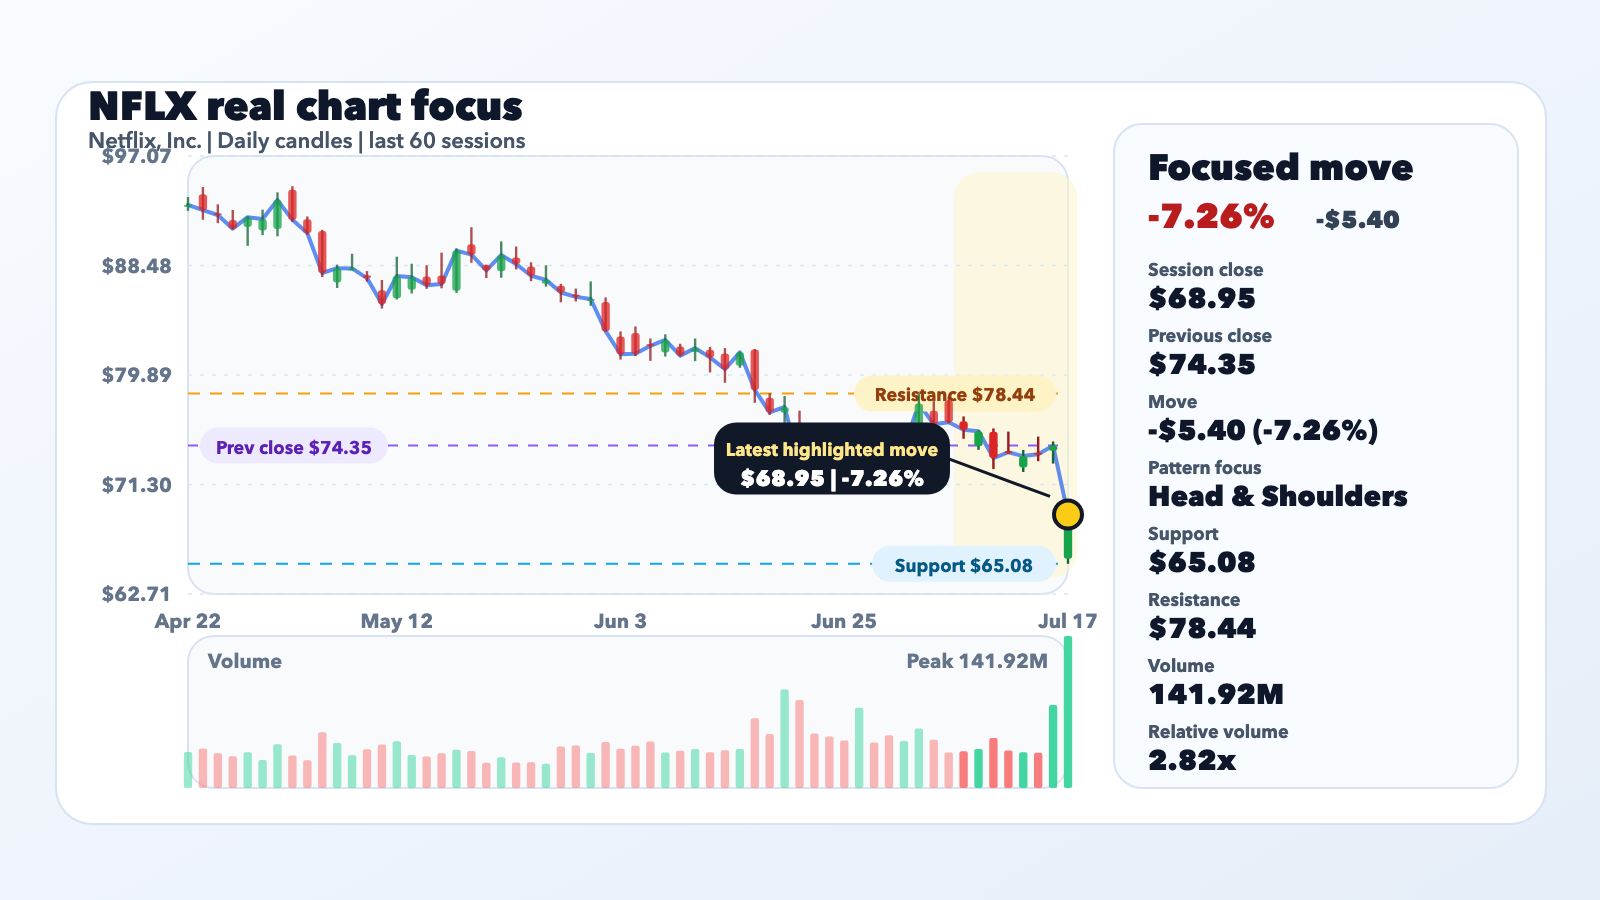
Netflix, Inc. (NFLX) fell 7.26% in the latest regular session, closing Friday, July 17 at $68.95 versus $74.35 the previous close. ChartNova's deterministic scan flagged Head & Shoulders as the cleanest same-run setup, and volume reached 2.82 times the stock's recent 20-day average.
Chart lens
The chart case starts with Head & Shoulders. The scanner tagged the stock with a bearish structure aligned with the current move. The latest 20-session range puts support near $65.08 and resistance near $78.44. A decisive break below support with follow-through volume would strengthen the bearish signal, while a recovery through resistance would weaken it. The chart/data source is Yahoo Finance chart data consumed through ChartNova's existing pattern vocabulary: https://query1.finance.yahoo.com/v8/finance/chart/NFLX?range=1y&interval=1d&includePrePost=false&events=div,splits.
Catalyst lens
Netflix's July 16 shareholder letter reported second-quarter revenue of $12.56 billion, up 13.4% year over year, and forecast third-quarter revenue of $12.86 billion, 11.7% growth, and diluted earnings per share of $0.82. The Associated Press reported that Wall Street expected roughly $13 billion of third-quarter revenue and linked the share decline to the forecast falling short of expectations. That direct company disclosure plus independent reporting ties the catalyst to the move instead of forcing a narrative onto a random price swing.
Why the setup matters
NFLX's selloff matters because the price reaction, elevated volume, and bearish Head & Shoulders label point in the same direction. The next test is whether the stock stabilizes above $65.08 after the earnings reaction or breaks that area with continued selling. A rebound through $78.44 would challenge the current bearish structure.
Caution
A detected pattern is not a price target and it is not investment advice. Head & Shoulders is a structure label, not a guarantee. The support and resistance levels are recent-range reference points, and the signal can change as new price, volume, company, or macro information arrives.