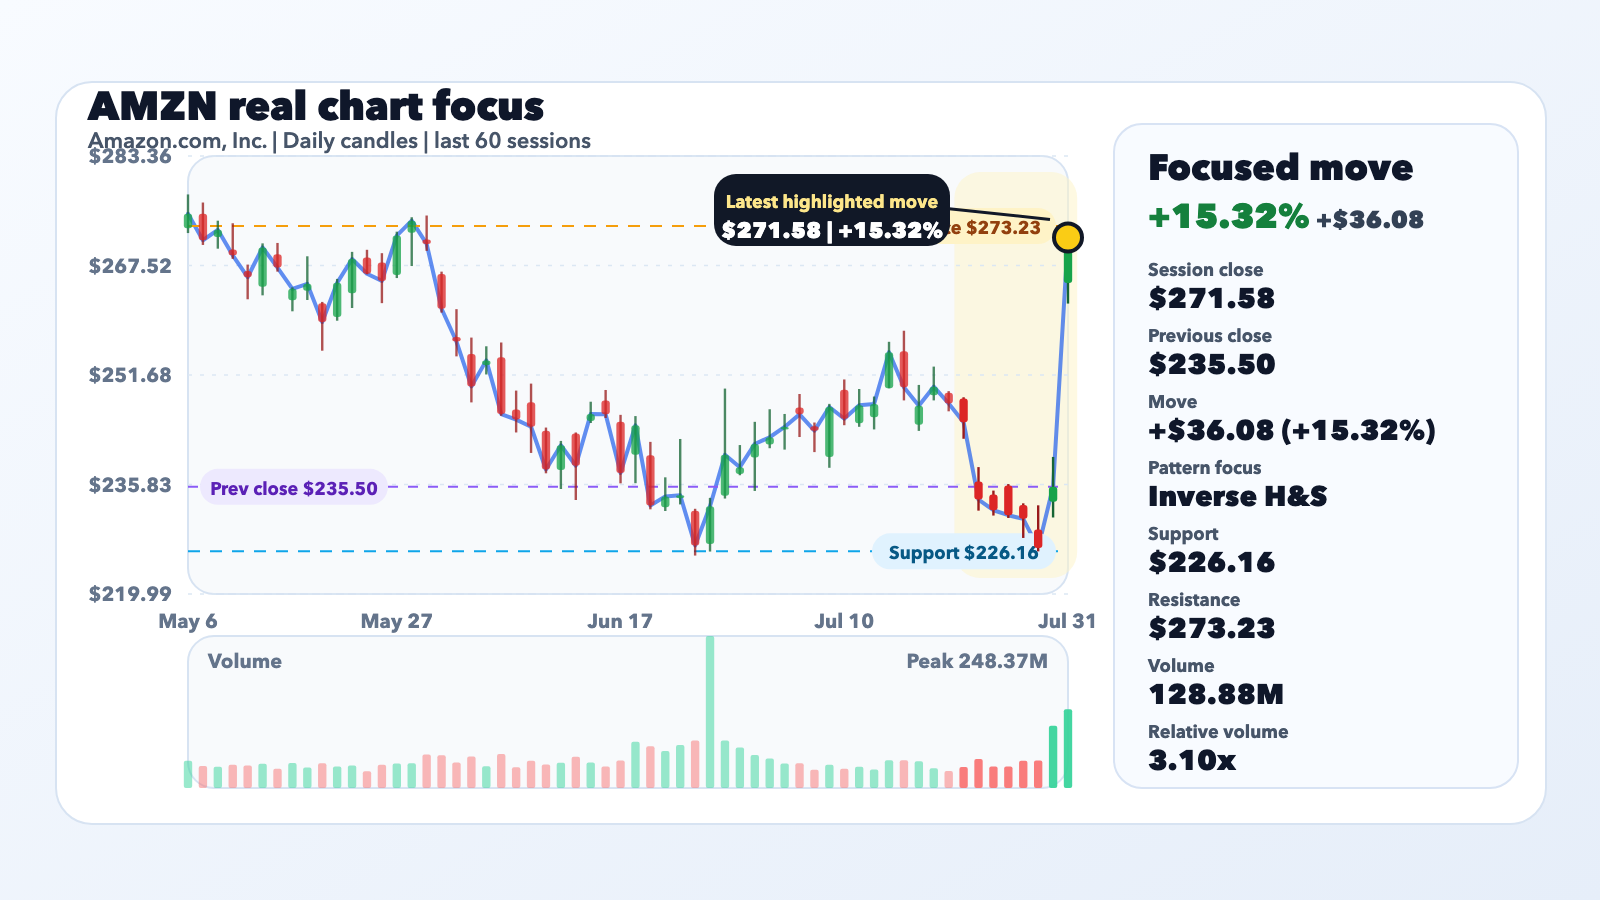
Amazon.com, Inc. (AMZN) rose 15.32% in the completed regular session, closing at $271.58 versus $235.50 the previous close. ChartNova's deterministic scan flagged Inverse H&S as the cleanest same-run setup, and the move came with 3.10x of the stock's recent 20-day average volume.
Chart lens
The chart case starts with Inverse H&S. Middle trough near 218.15 with shoulders near 228.15 and 219.51. That keeps the pattern description anchored to the same price zone as the current move. In practical terms, $226.16 is the support area to watch on pullbacks while $273.23 is the nearest resistance or breakout confirmation zone. The chart/data source for this read is Yahoo Finance chart data consumed through ChartNova's existing pattern vocabulary: https://query1.finance.yahoo.com/v8/finance/chart/AMZN?range=1y&interval=1d&includePrePost=false&events=div,splits.
Catalyst lens
ir.aboutamazon and apnews both tied the move to the same source-backed event (growth, results, second): "Amazon.com Announces Second Quarter Results" and "Amazon to spend billions more on AI after posting strong Q2 results | AP News". That source trail matters because it lines up with the tape instead of forcing a story onto a random price swing. The combination of a visible catalyst and a chart-confirmable move is what moves this from noise into a publishable stock story.
Why the setup matters
AMZN's rally matters because the move lines up with an Inverse H&S setup on the ChartNova pattern map and same-run source coverage from ir.aboutamazon. The move is not just about today's percentage change; it is about whether the stock can hold the current structure after the catalyst headline cools off. If buyers defend $226.16, the pattern can keep its momentum case. If sellers reclaim the stock below that area, the signal weakens quickly.
Caution
A detected pattern is not a price target and it is not investment advice. Inverse H&S is a structure label, not a guarantee. Traders and investors still need to watch follow-through volume, the next company or macro update, and whether the stock can stay above support or break through resistance after the first reaction fades.