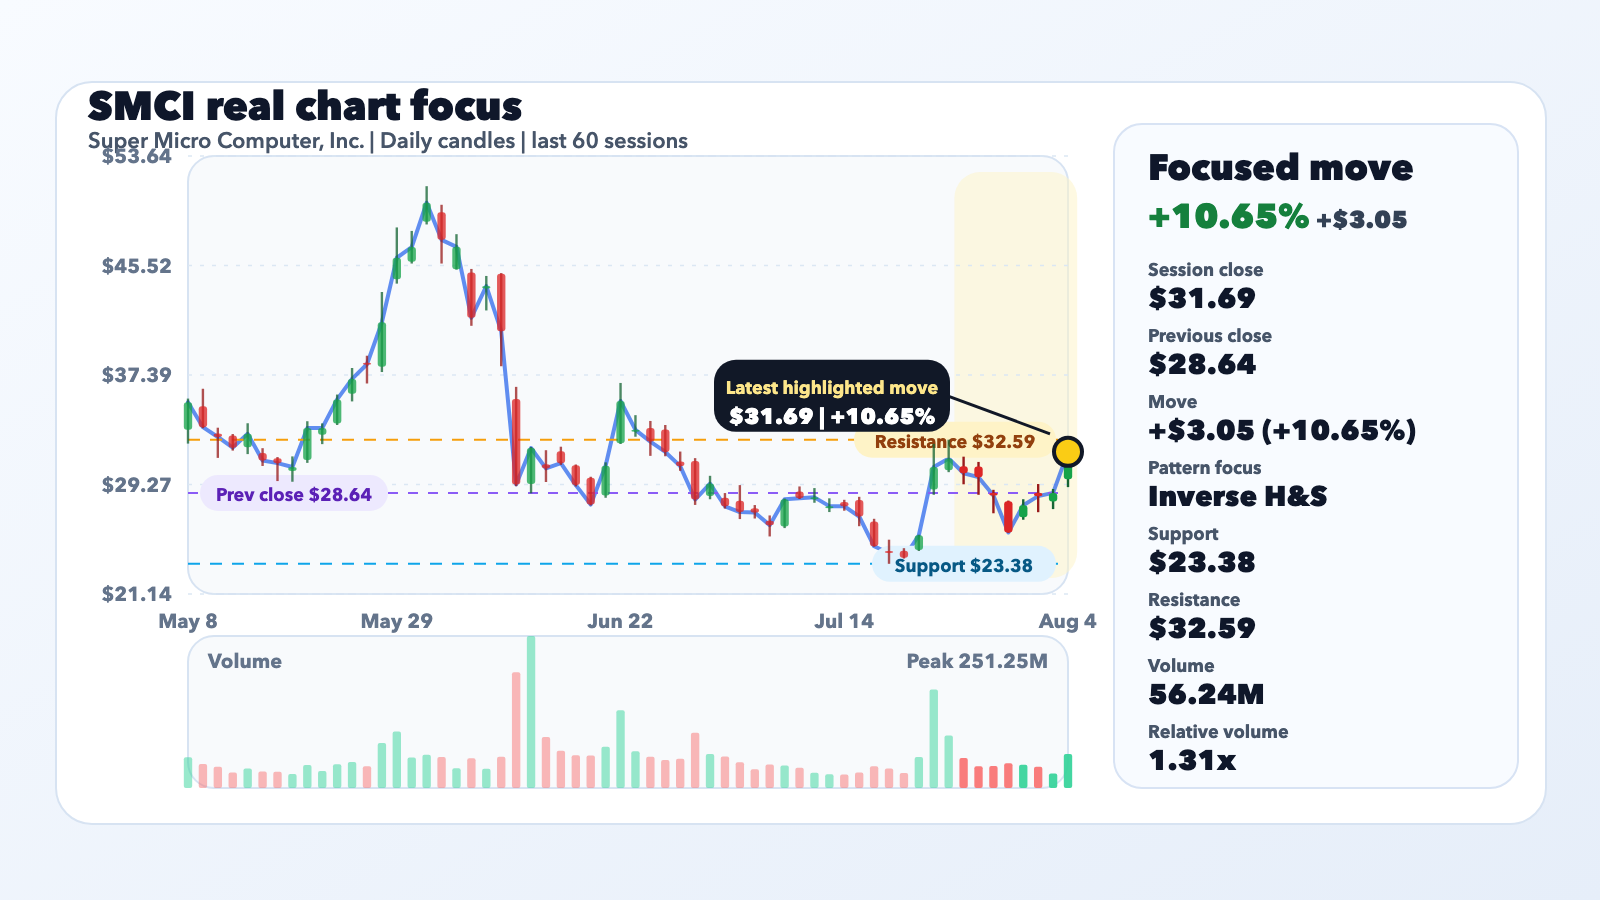
Super Micro Computer, Inc. (SMCI) rose 10.65% in the completed regular session, closing at $31.69 versus $28.64 the previous close. ChartNova's deterministic scan flagged Inverse H&S as the cleanest same-run setup, and the move came with 1.31x of the stock's recent 20-day average volume.
Chart lens
The chart case starts with Inverse H&S. The scanner tagged the stock with an Inverse H&S signal that is directionally aligned with the current move. In practical terms, $23.38 is the support area to watch on pullbacks while $32.59 is the nearest resistance or breakout confirmation zone. The chart/data source for this read is Yahoo Finance chart data consumed through ChartNova's existing pattern vocabulary: https://query1.finance.yahoo.com/v8/finance/chart/SMCI?range=1y&interval=1d&includePrePost=false&events=div,splits.
Catalyst lens
24/7 Wall St. reported "Dell and Super Micro Rally 10%, Hewlett Packard Enterprise Climbs 6% as AI Server Stocks Surge", while Zacks provided separate same-day context in "Super Micro Computer (SMCI) Earnings Expected to Grow: What to Know Ahead of Next Week's Release". The available sources do not independently confirm one shared catalyst, so the price move should not be attributed to a single event. These reports are useful background on the company, but they are presented separately from the measured price move and chart setup.
Why the setup matters
SMCI's rally matters because the price structure carries an Inverse H&S signal; the two reports add company context but do not establish what caused the move. The decision-useful question is whether the stock can hold the current structure. If buyers defend $23.38, the pattern can keep its momentum case. If sellers reclaim the stock below that area, the signal weakens quickly. Neither source is being used to explain that price behavior.
Caution
A detected pattern is not a price target and it is not investment advice. Inverse H&S is a structure label, not a guarantee. The cited reports provide context only; they do not establish why the stock moved. Watch follow-through volume, the next company or macro update, and whether the stock can stay above support or break through resistance.