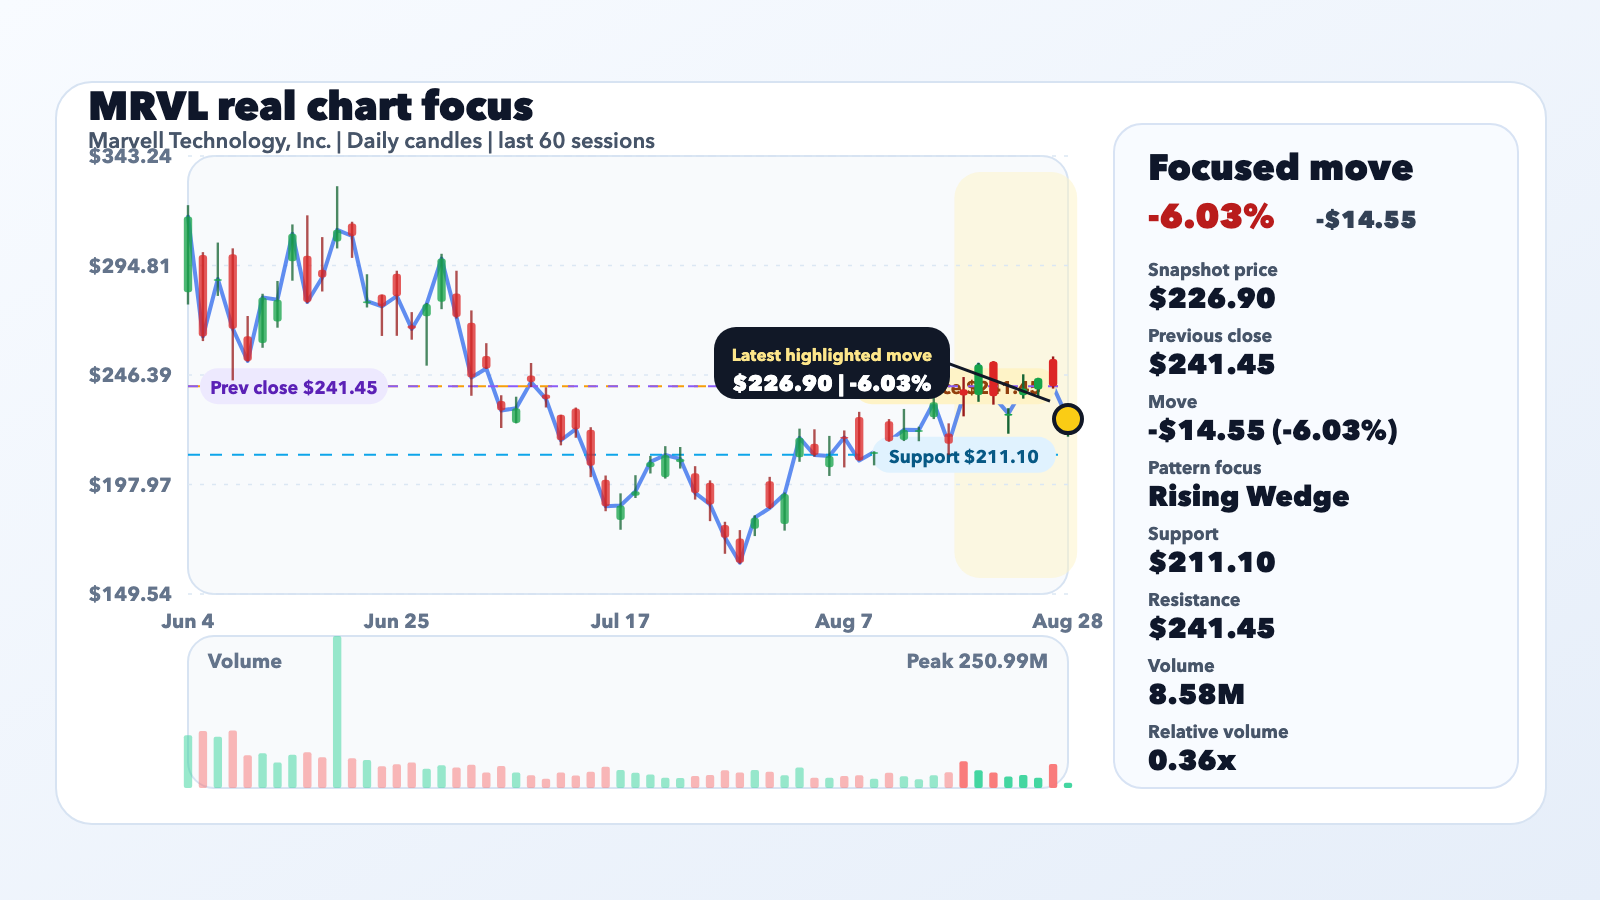
MRVL's selloff matters because the price structure carries a Rising Wedge signal; the two reports add company context but do not establish what caused the move.
What happened
At the 9:39am EDT market snapshot, Marvell Technology, Inc. (MRVL) was down 6.03% from the previous close, trading at $226.90 versus $241.45. The same-run chart pack—not a delayed headline feed—anchors the price, previous-close, range, and volume calculations used below.
Move anatomy
The stock opened with a -6.69% gap from the prior close, then moved +0.71% from the open to the snapshot price, and stood at 99.2% of the session's low-to-high range. Snapshot volume was 0.36x its prior 20-session average, the 0th percentile of that sample, and a -1.95 standard-deviation reading of the comparable prior full-session sample; the current session is still partial. This separates overnight repricing from buying or selling that occurred during the session.
Catalyst lens: Likely drivers and confidence
Catalyst confidence is context only: the retained reports do not establish why the stock moved. The bounded evidence record from MT Newswires says Update: Marvell Technology Shares Fall Pre-Bell on Google Deal Concerns Despite Fiscal Q2 Results Beat, published on the target session date; The bounded evidence record from 24/7 Wall St. says Marvell Falls 7% as Google AI Payoff Lands in Fiscal 2029, Intel Slips, NVIDIA Barely Budges, published on the target session date. They do not independently confirm one shared catalyst and are not being used to explain the price move. Other possible explanations include sector or market sympathy, technical positioning, event anticipation, and an unreported company-specific development.
Tape and trend context
Momentum is -4.28% over 5 sessions, +20.97% over 20 sessions, and -24.78% over 60 sessions. The snapshot price is above the 20-day average of $224.68 (+0.99% versus that average), below the 50-day average of $228.76 (-0.81% versus that average), and above the 200-day average of $148.70 (+52.59% versus that average). Within the available 52-week range, the snapshot price sits at 61.6% of the span between $61.44 and $329.88.
Chart lens: Technical structure and competing signals
The Chart lens centers on Rising Wedge, recorded with medium confidence. The scanner tagged the stock with a Rising Wedge signal that is relevant to the current move. Its measured evidence window runs from 2026-07-06 through 2026-08-28 and ends on the current candle. The same scan also found competing signals, including Head & Shoulders (bearish), Inverse H&S (bullish), Double Top (bearish), and Double Bottom (bullish), so the selected label should not be read in isolation. Fourteen-session ATR is $16.27, or 7.2% of the snapshot price, which gives scale to the day's move and the distance between levels.
What the market may be pricing
What the market may be pricing remains a hypothesis, not a sourced fact. The 5- and 20-session returns point in opposite directions, which is more consistent with a rebound or reversal attempt than an already-established trend. Volume at only 0.36x the prior average weakens confirmation and raises the risk of a low-participation move. The snapshot price is above its 20-day average.
Bull, base, and bear cases
Bull case: price reclaims $241.45 and holds above it, weakening the bearish setup. Base case: the stock consolidates between $211.10 and $241.45 while the market waits for fresher evidence. Bear case: rejection at resistance followed by a close below $211.10 supports continuation of Rising Wedge. The detector supplies no formal pattern invalidation. These are observable conditions, not predictions or price targets.
Why the setup matters: Near-term levels and invalidation
Why the setup matters is the proximity and meaning of its checkpoints. $211.10 is the support reference (prior_range_low), 6.96% below the snapshot price. $241.45 is the nearest measured overhead resistance reference (previous_session_close), 6.41% above the snapshot price. For Rising Wedge, a close above $241.45 is a practical setup-risk threshold, not a detector-supplied pattern invalidation; touching a level intraday is not confirmation by itself.
Known unknowns and upcoming events
Known unknowns are whether a fresh filing or investor-relations update supplies the missing direct evidence, whether sector or index moves explain part of the tape, and whether the next session confirms volume and levels. The requested chart horizons were available without a recorded deterministic data limitation.
Caution
Rising Wedge is a structure label, not a price target or guarantee. This briefing is not investment advice. Price can gap through either reference, snapshot volume remains partial, and later company or macro information can invalidate the setup.