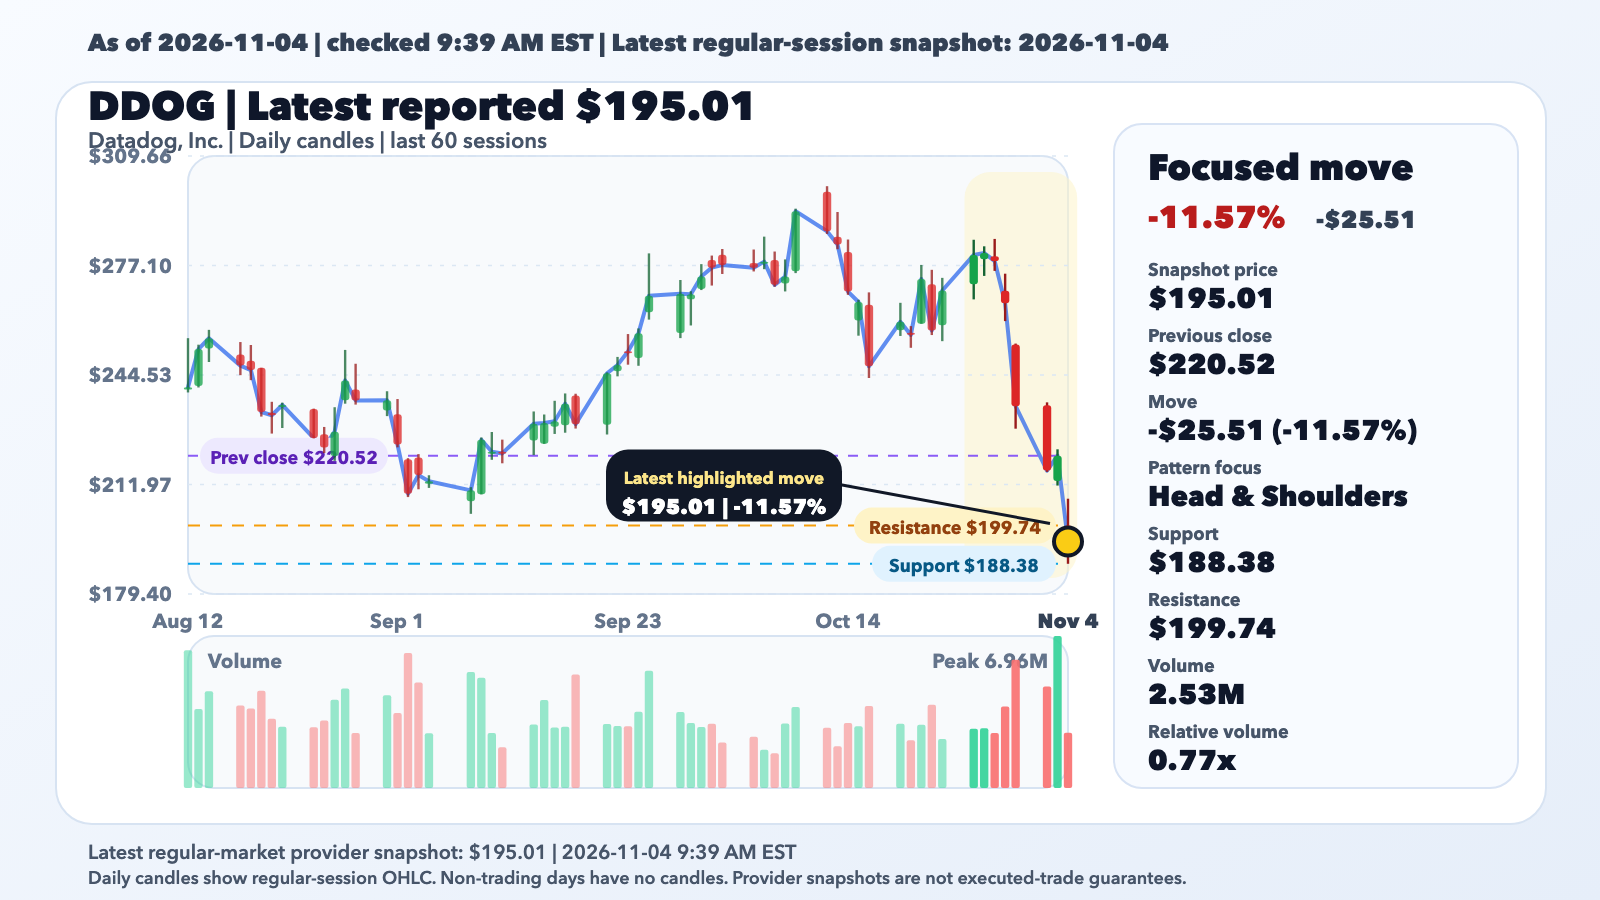
DDOG's selloff matters because the move lines up with a Head & Shoulders setup on the ChartNova pattern map and same-run source coverage from GlobeNewswire.
What happened
As of 2026-11-04 at 9:39am EST, Yahoo's regular-session snapshot for Datadog, Inc. (DDOG) on 2026-11-04 was $195.01 at 9:39am EST, down 11.57% versus the previous close of $220.52. The latest available Yahoo regular-market snapshot was $195.01 at 9:39 AM EST on 2026-11-04; it is a provider snapshot, not a guaranteed executed-trade quote. The same-run chart pack—not a delayed headline feed—anchors the price, previous-close, range, and volume calculations used below.
Move anatomy
The stock opened with a -9.42% gap from the prior close, then moved -2.37% from the open to the snapshot price, and stood at 34.2% of the session's low-to-high range. Snapshot volume was 0.77x its prior 20-session average, the 25th percentile of that sample, and a -0.59 standard-deviation reading of the comparable prior full-session sample; the current session is still partial. This separates overnight repricing from buying or selling that occurred during the session.
Catalyst lens: Likely drivers and confidence
Catalyst confidence is classified as confirmed. GlobeNewswire and Zacks corroborate the same source-backed event. The bounded evidence record from GlobeNewswire says Datadog Announces Third Quarter 2026 Financial Results, published on the target session date; The bounded evidence record from Zacks says Datadog (DDOG) Beats Q3 Earnings and Revenue Estimates, published on the target session date. The attribution is bounded to those records and does not turn a chart pattern into proof of causation.
Tape and trend context
Momentum is -29.96% over 5 sessions, -28.13% over 20 sessions, and -20.98% over 60 sessions. The snapshot price is below the 20-day average of $260.49 (-25.14% versus that average), below the 50-day average of $250.21 (-22.06% versus that average), and below the 200-day average of $199.71 (-2.36% versus that average). Within the available 52-week range, the snapshot price sits at 47.9% of the span between $98.01 and $300.68.
Chart lens: Technical structure and competing signals
The Chart lens centers on Head & Shoulders, recorded with medium confidence. The scanner tagged the stock with a Head & Shoulders signal that is relevant to the current move. Its measured evidence window runs from 2026-07-14 through 2026-08-14, ending 57 sessions before the current candle. The same scan also found competing signals, including Inverse H&S (bullish), Double Top (bearish), Double Bottom (bullish), and Triple Top (bearish), so the selected label should not be read in isolation. Fourteen-session ATR is $18.99, or 9.7% of the snapshot price, which gives scale to the day's move and the distance between levels.
What the market may be pricing
What the market may be pricing remains a hypothesis, not a sourced fact. The aligned negative 5- and 20-session returns suggest the market is extending an existing move rather than reacting only for one day. Volume at only 0.77x the prior average weakens confirmation and raises the risk of a low-participation move. The snapshot price is below its 20-day average. The source pair supports an event hypothesis, while follow-through still determines whether that interpretation persists.
Bull, base, and bear cases
Bull case: price reclaims $199.74 and holds above it, weakening the bearish setup. Base case: the stock consolidates between $188.38 and $199.74 while the market waits for fresher evidence. Bear case: rejection at resistance followed by a close below $188.38 supports continuation of Head & Shoulders. The detector supplies no formal pattern invalidation. These are observable conditions, not predictions or price targets.
Why the setup matters: Near-term levels and invalidation
Why the setup matters is the proximity and meaning of its checkpoints. $188.38 is the support reference (current_session_low), 3.40% below the snapshot price. $199.74 is the nearest measured overhead resistance reference (current_session_open), 2.43% above the snapshot price. For Head & Shoulders, a close above $199.74 is a practical setup-risk threshold, not a detector-supplied pattern invalidation; touching a level intraday is not confirmation by itself.
Known unknowns and upcoming events
Known unknowns are whether a fresh filing or investor-relations update adds to the direct record, whether sector or index moves explain part of the tape, and whether the next session confirms volume and levels. The requested chart horizons were available without a recorded deterministic data limitation.
Caution
Head & Shoulders is a structure label, not a price target or guarantee. This briefing is not investment advice. Price can gap through either reference, snapshot volume remains partial, and later company or macro information can invalidate the setup.