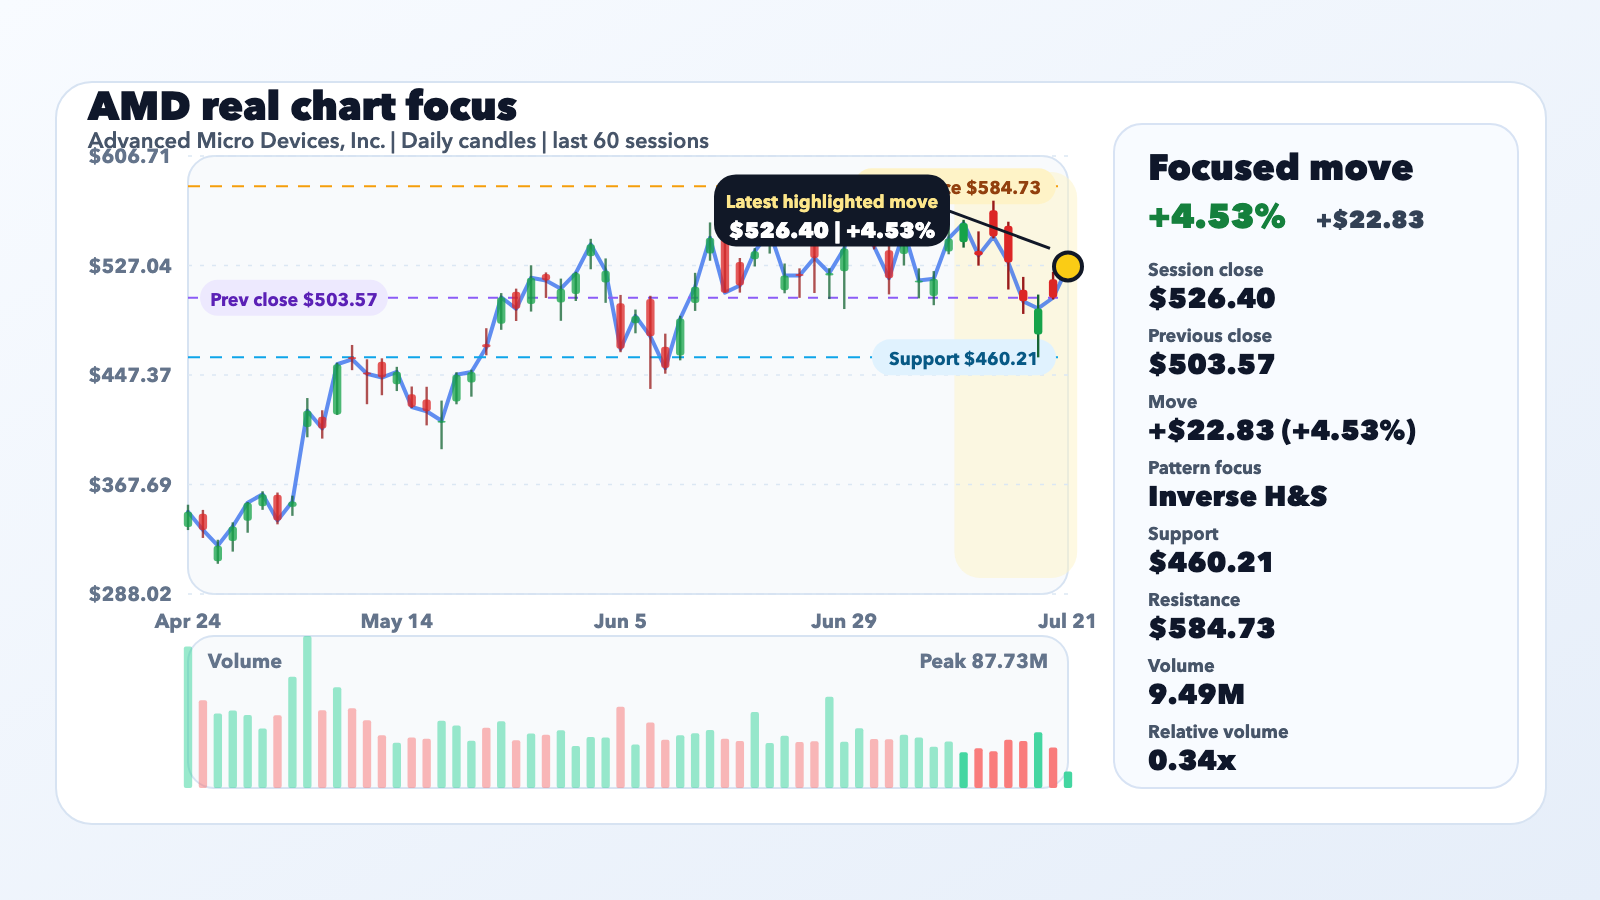
At the 11:00 a.m. EDT snapshot on July 21, Advanced Micro Devices, Inc. (AMD) was trading at $526.40, up 4.53% from the previous close of $503.57. ChartNova's deterministic scan flagged Inverse H&S as the cleanest same-run setup, and reported volume at that point was 0.34x of the stock's recent 20-day full-session average.
Chart lens
The chart case starts with Inverse H&S. The scanner tagged the stock with an Inverse H&S signal that is directionally aligned with the current move. In practical terms, $460.21 is the support area to watch on pullbacks while $584.73 is the nearest resistance or breakout confirmation zone. The chart/data source for this read is Yahoo Finance chart data consumed through ChartNova's existing pattern vocabulary: https://query1.finance.yahoo.com/v8/finance/chart/AMD?range=1y&interval=1d&includePrePost=false&events=div,splits.
Catalyst lens
AMD's own event announcement establishes that Advancing AI 2026 is its flagship AI event and will be livestreamed on July 23. Investing.com independently reported on July 21 that investors were positioning ahead of the event and cited additional momentum from AMD's expanded Microsoft partnership. That distinct primary-and-independent source trail lines up with the tape instead of forcing a story onto a random price swing.
Why the setup matters
AMD's rally matters because the move lines up with an Inverse H&S setup on the ChartNova pattern map, a confirmed company event, and independent same-day reporting about investor positioning. The move is not just about today's percentage change; it is about whether the stock can hold the current structure after the catalyst headline cools off. If buyers defend $460.21, the pattern can keep its momentum case. If sellers reclaim the stock below that area, the signal weakens quickly.
Caution
A detected pattern is not a price target and it is not investment advice. Inverse H&S is a structure label, not a guarantee. Traders and investors still need to watch follow-through volume, the next company or macro update, and whether the stock can stay above support or break through resistance after the first reaction fades.